
August 1st
Added favicon; Added click event listener to regions created during era update; Set RegionStats to update on era change; Allowed for deselection of region; Finalized rudimentary RegionStats formatting; Began updating event and character information.
Here's the plan:
- Tuesday: Add another era?, finalize, and ready presentation
July 30th
Character coding complete. The overflow issue was a typo in the code. I have the modal window triggered when a character image is clicked, and I changed the variable names and elements ids to reflect that the modal window is not just for event information.
Here's the plan:
- Sunday: Region details code complete; Complete data for current regions
- Tuesday: Add another era?, finalize, and ready presentation
July 29th
Character coding is nearly done. I have it pulling in character information from a tsv file, and populating the toggle box. Each character image is surrounded by a border that is the same color the character's corresponding culture. I just need to fix an issue with some text overlap, and write the code to fill and trigger the modal window when the character is clicked.
Here's the plan:
- Saturday: Character code complete, Begin Region details code
- Sunday: Region details code complete; Complete data for current regions
- Tuesday: Add another era?, finalize, and ready presentation
July 28th
I went to Sprout Space tonight, and formulated a plan for the character coding. Then I spent the rest of the time helping Faisal and Molly build a wooden arcade game container. It was a great night! We'll be meeting again to finish it up on Monday.
I'm a little off schedule, but it was worth it. Here's the new plan:
- Friday: Character code complete
- Saturday: Region details code complete
- Sunday: Complete data for current regions
- Tuesday: Add another era(s?), finalize, and ready presentation
July 27th
Attul and I created a typing visualization that allows the user to see the relative number of each character that is typed.
Events coding is complete. During the era transition the system checks a tsv file for any events that happened during that era. If any events are found, notification boxes for each event fall down on the left hand side of the screen and stack on top of each other (I'm pretty proud of this effect). Each box contains an image that signifies the type of event that it represents. When the user clicks on a box a modal window is updated with information about that event (again from the tsv file) and is displayed. When the user closes the modal window, the corresponding notification box is removed from the DOM, and any boxes that were stacked on top of it fall down to fill the vacuum (This effect is awesome too!). All I have to do to add more events is update the tsv file; everything else is automated in the code.
So far I'm on schedule. Here's the plan:
- Thursday: Character code complete
- Friday: Region details code complete
- Sunday: Complete data for current regions
- Monday: Add another era(s?)
- Tuesday: Finalize and ready presentation
July 25th
I was exposed the Reveal.js today. I think my PowerPoint application is going to get lonely.
Alec is going to look into a solution for the disconnected D3 path issue. I completed the region labeling code, using a logarithm and path.area to scale the label size based on region size. I also set the update function to check each proposed font size against a threshold to prevent small labels from being displayed and cluttering up the view area. I need to create a tooltip for the resulting non-labeled regions. I added a button to control the era change.
Added dynamically generated largest nation statistics based on path area and whether or not the region represents an actual nation or just a general area of loosely associated peoples (based on a value I added to each nation in the nation table.)
Created an era table to store era-specific information such as era date, json filename, and era description. Modified the json loading process to use information from this table, and to automatically adjust which file needs to be loaded as the era's progress. Now, when I create a new era all I have to do is add a new row to this table, and the JavaScript does the rest.
Now the era description toggle box pulls the description from the era table. I just need to add the content.
I made some updates to a few of the region paths based on new information.
My current tentative goals schedule is as follows:
- Wednesday: Events code complete
- Thursday: Character code complete
- Friday: Region details code complete
- Sunday: Complete data for current regions
- Monday: Add another era
- Tuesday: Finalize and ready presentation
July 24th
I fixed two of the three problems with the transition: To fix the node increase issue, I wrote a homogenizeNodes function that runs on each GeoJSON file as it is loaded. It compares the number of nodes in a region to the max nodes as listed the region csv file. If the current number of nodes is lower than that max, it artificially adds enough nodes stacked on top of the other at the beginning of the path to make up the difference. This worked nicely to fix the the issue, though now there is a bit of an "unscrolling" effect if the difference in nodes is large. Eventually, I will fix this by dispersing the artificial nodes throughout the path. The opacity issue was essentially a typo, and I will postpone fixing the disconnected paths issue until after the class.
I added rudimentary region labels.
July 21st
I created the next set of region paths (Greater Europe, AD406), and began working on the transition between the eras. I chose to load the data for each era as a separate JSON file to conserve RAM usage. At any given time, no more than three era's worth of data will be loaded: the current era, and the next and previous eras for delay-free transitions. Once an era changes, the era data shifts down (previous is overwritten by current, current is overwritten by next, and next loads the next dataset.)
I got the transition working effectively; however, there are three primary issues: if a path is transitioning to a larger number of nodes, the new nodes appear immediately at the new location; also, the regions disconnect during transition; finally, when a region is conquered the opacity decreases to 0 immediately instead of following the transition duration.
July 20th
I realized that I will not be able to use the few coordinate files that I created a few years ago in Google Earth. The coordinates are saved in two completely different formats, and it would be faster to recreate them directly as GeoJSON that to write code to convert the format. In addition, the coordinate paths were much lower resolution than I remembered.
I found a great website to graphically generate GeoJSON files: Simple GeoJSON Editor. I used this platform to create the first set of region paths for my project (Greater Europe, AD362), and replaced my placeholder D3 world map with this map. Rather than storing all region data in the paths themselves, I am using the path ids to link to a csv file with region name and culture coding.
July 18th
Atul and I created Rainbow Arthritis during class. Press any key to raise all color values. Press R, G, or B to give and extra boost to the Red, Green, or Blue channels, respectively. Match the given values within a threshold of +-10 to win.
Other than a few minor elements, the interface is complete. Toggle boxes working nicely, and a placeholder for the era date. With the addition of a few CSS shadow effects, the look is really starting to come together. Now on to the data. By the end of the week, I would like to have at least one border transition complete, preferably five (~one century of data), as well as the accompanying descriptions and the ability to click on countries. Next week I will work on the events, and character data. If I have time I'll add the global statistics.
July 15th
Ha ha! This is getting so fun! The minimap is completely functional, both as a response to primary navigation and as a control to primary navigation. I also adjusted the travel speed of the primary navigation according to zoom level so that navigation is not uncontrollably fast at high zoom.
Next up: Era date label and toggle boxes.
July 13th
Completed initial navigation in all four compass directions using arrow regions on the borders of the window as affordances (Bennett's idea). Terminable continuous scrolling achieved through the use of setInterval and clearInterval on mouseover and mouseout, respectively. Constraints set on the pan amount to prevent going off of the map.
Zoom function completed. Google does not allow for granular zooming, so I attached a function to the mouse wheel that sensed the direction of rotation and increased or decreased the zoom level to one of three zoom amounts (defined by Google). Used setTimeout and boolean zoomLock variable to decrease the sensitivity of the zoom, and allow time for the smooth transition effect. Created a conversion formula to automatically calculate the appropriate scale for the D3 map. Disabled panning on full zoom out.
Began working on the minimap in the lower-left corner of the screen.
I would like to have the complete framework (Minus a few superficial design elements) complete before Monday so that I can begin working on data integration next week.
July 11th
Struggled to perform animations on the test svg I created in Google Maps. Google does not allow for referencing of an svg once it has been created. After talking with Alec, I went back to the original idea of having a single svg overlayed on Google. Completed simultaneous map movement in on direction when triggered by an arbitrary mouseover event. Proof of concept complete; now it's on the real coding
July 9th
I couldn't let Google go. I believe I've found a way to make it work by placing each element in it's own svg tag, and anchoring that tag on the map via lat & long. Essentially, I would have a Google maps interface with custom overlays, but D3 would be controlling the animation within each overlay. If necessary, each svg could communicate with the other via global variables in the JS code. The net effect would appear to be a single animation, when in reality it would be a orchestration of several simultaneous events. I just need to test to make sure that the position of the polygons will remain predictable as the perimeters change.
I want to have this determined and decided for good no later than Wednesday.
July 6th
Researched other JS plugins recommended by Bakhtiar. I will likely be using the timeline module in vis.js for the timeline section of my interface.
Began exploring the possibility of using Google Maps as an connected backdrop to the d3 map. This is likely possible, but there is no straightforward way to do it on the scale that I will be working on. I will come back to this once more of the base design is complete.
July 1st
Tweaked the formatting of the primary interface of my project
Began looking at some resources provided by Bakhtiar.
June 30th
After further research, decided that D3 would be a better fit for my project than Process.
June 29th
Fixed a reference issue for a couple images on my people card.
I need to look into Process as a potential application to use for the map, instead of D3.
Added formatting to journal
Created the base framework for my project page. Using Bootstrap's grid system, I have a large svg containing a map of the world as the primary item on the page. Below this is a responsive control area. Though it does not yet have any functionality attached to it, it has basic visual formatting.
June 27th
Cool Digital Things
D3 is a powerful visualization tool that utilizes nothing but Javascript. One of my favorite D3 visualizations is "A Day in the Life of Americans".
Scratch programming interface is one of the best ways to introduce someone to computer programming, or to write a quick visual-heavy program for experienced programmers just wanting to have fun. Though the interface is simple, fairly complicated programs are still possible.
Continued brainstorming layout and extra-map functionality.
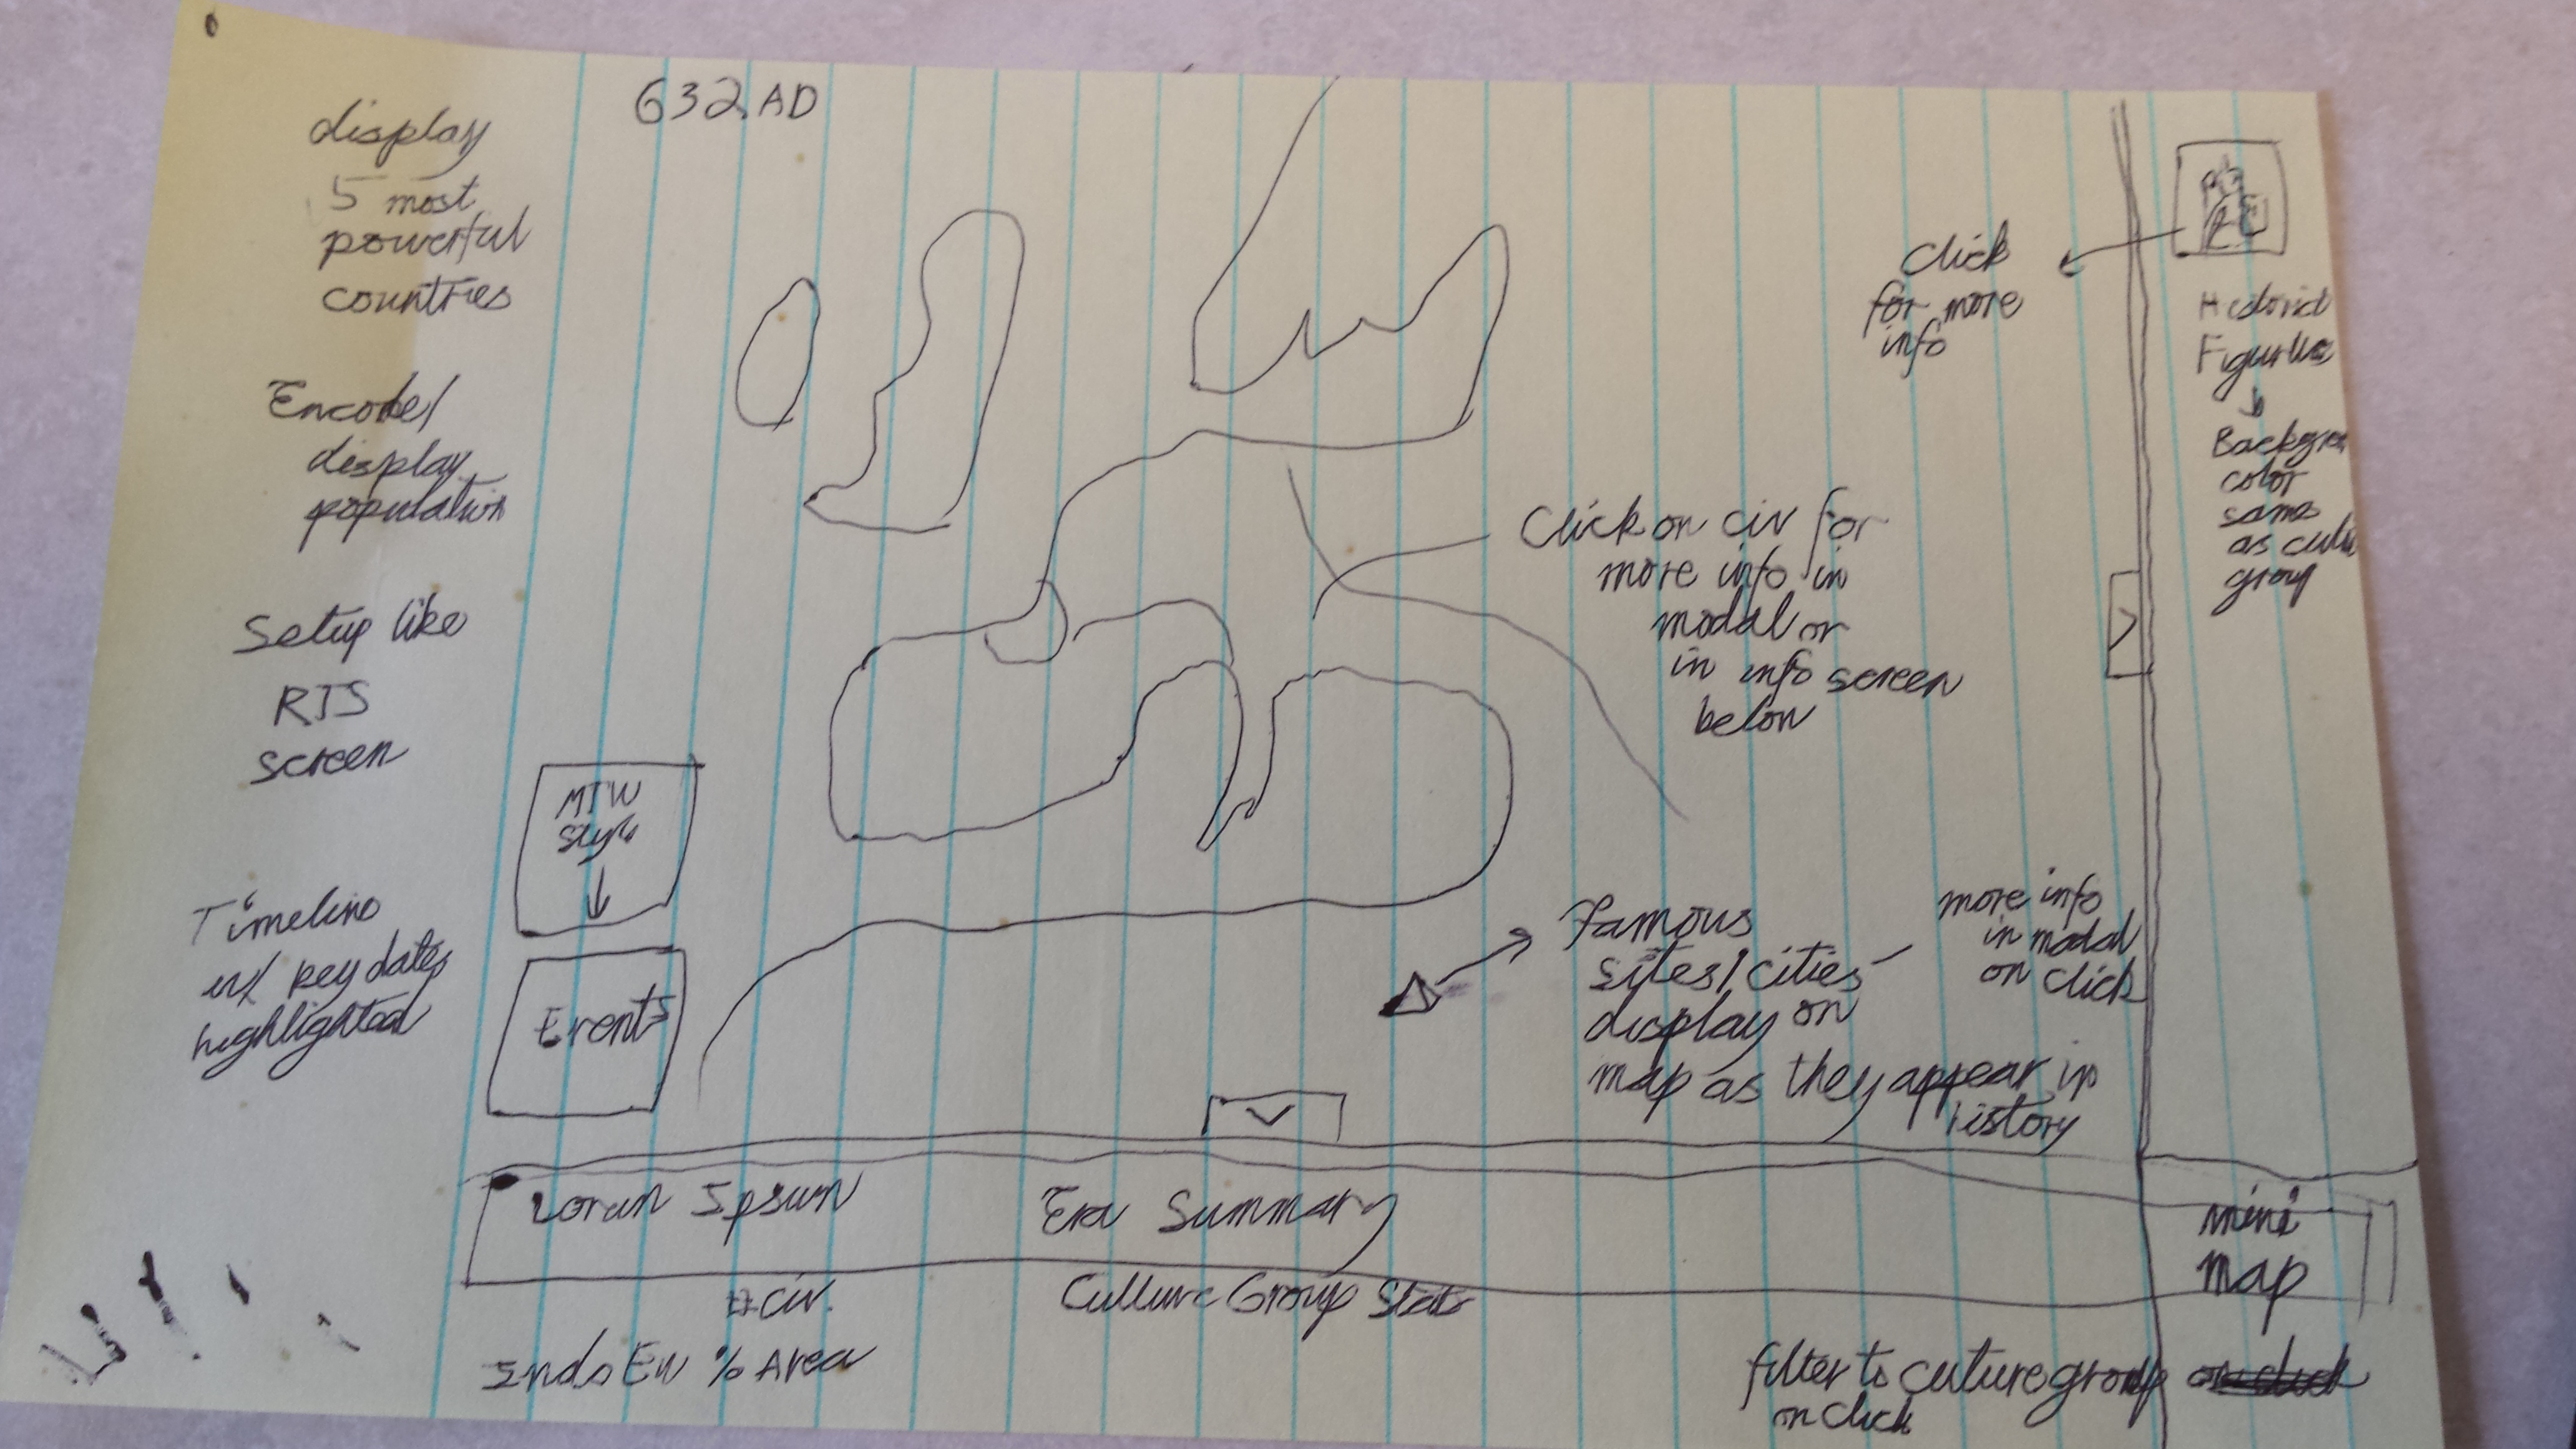
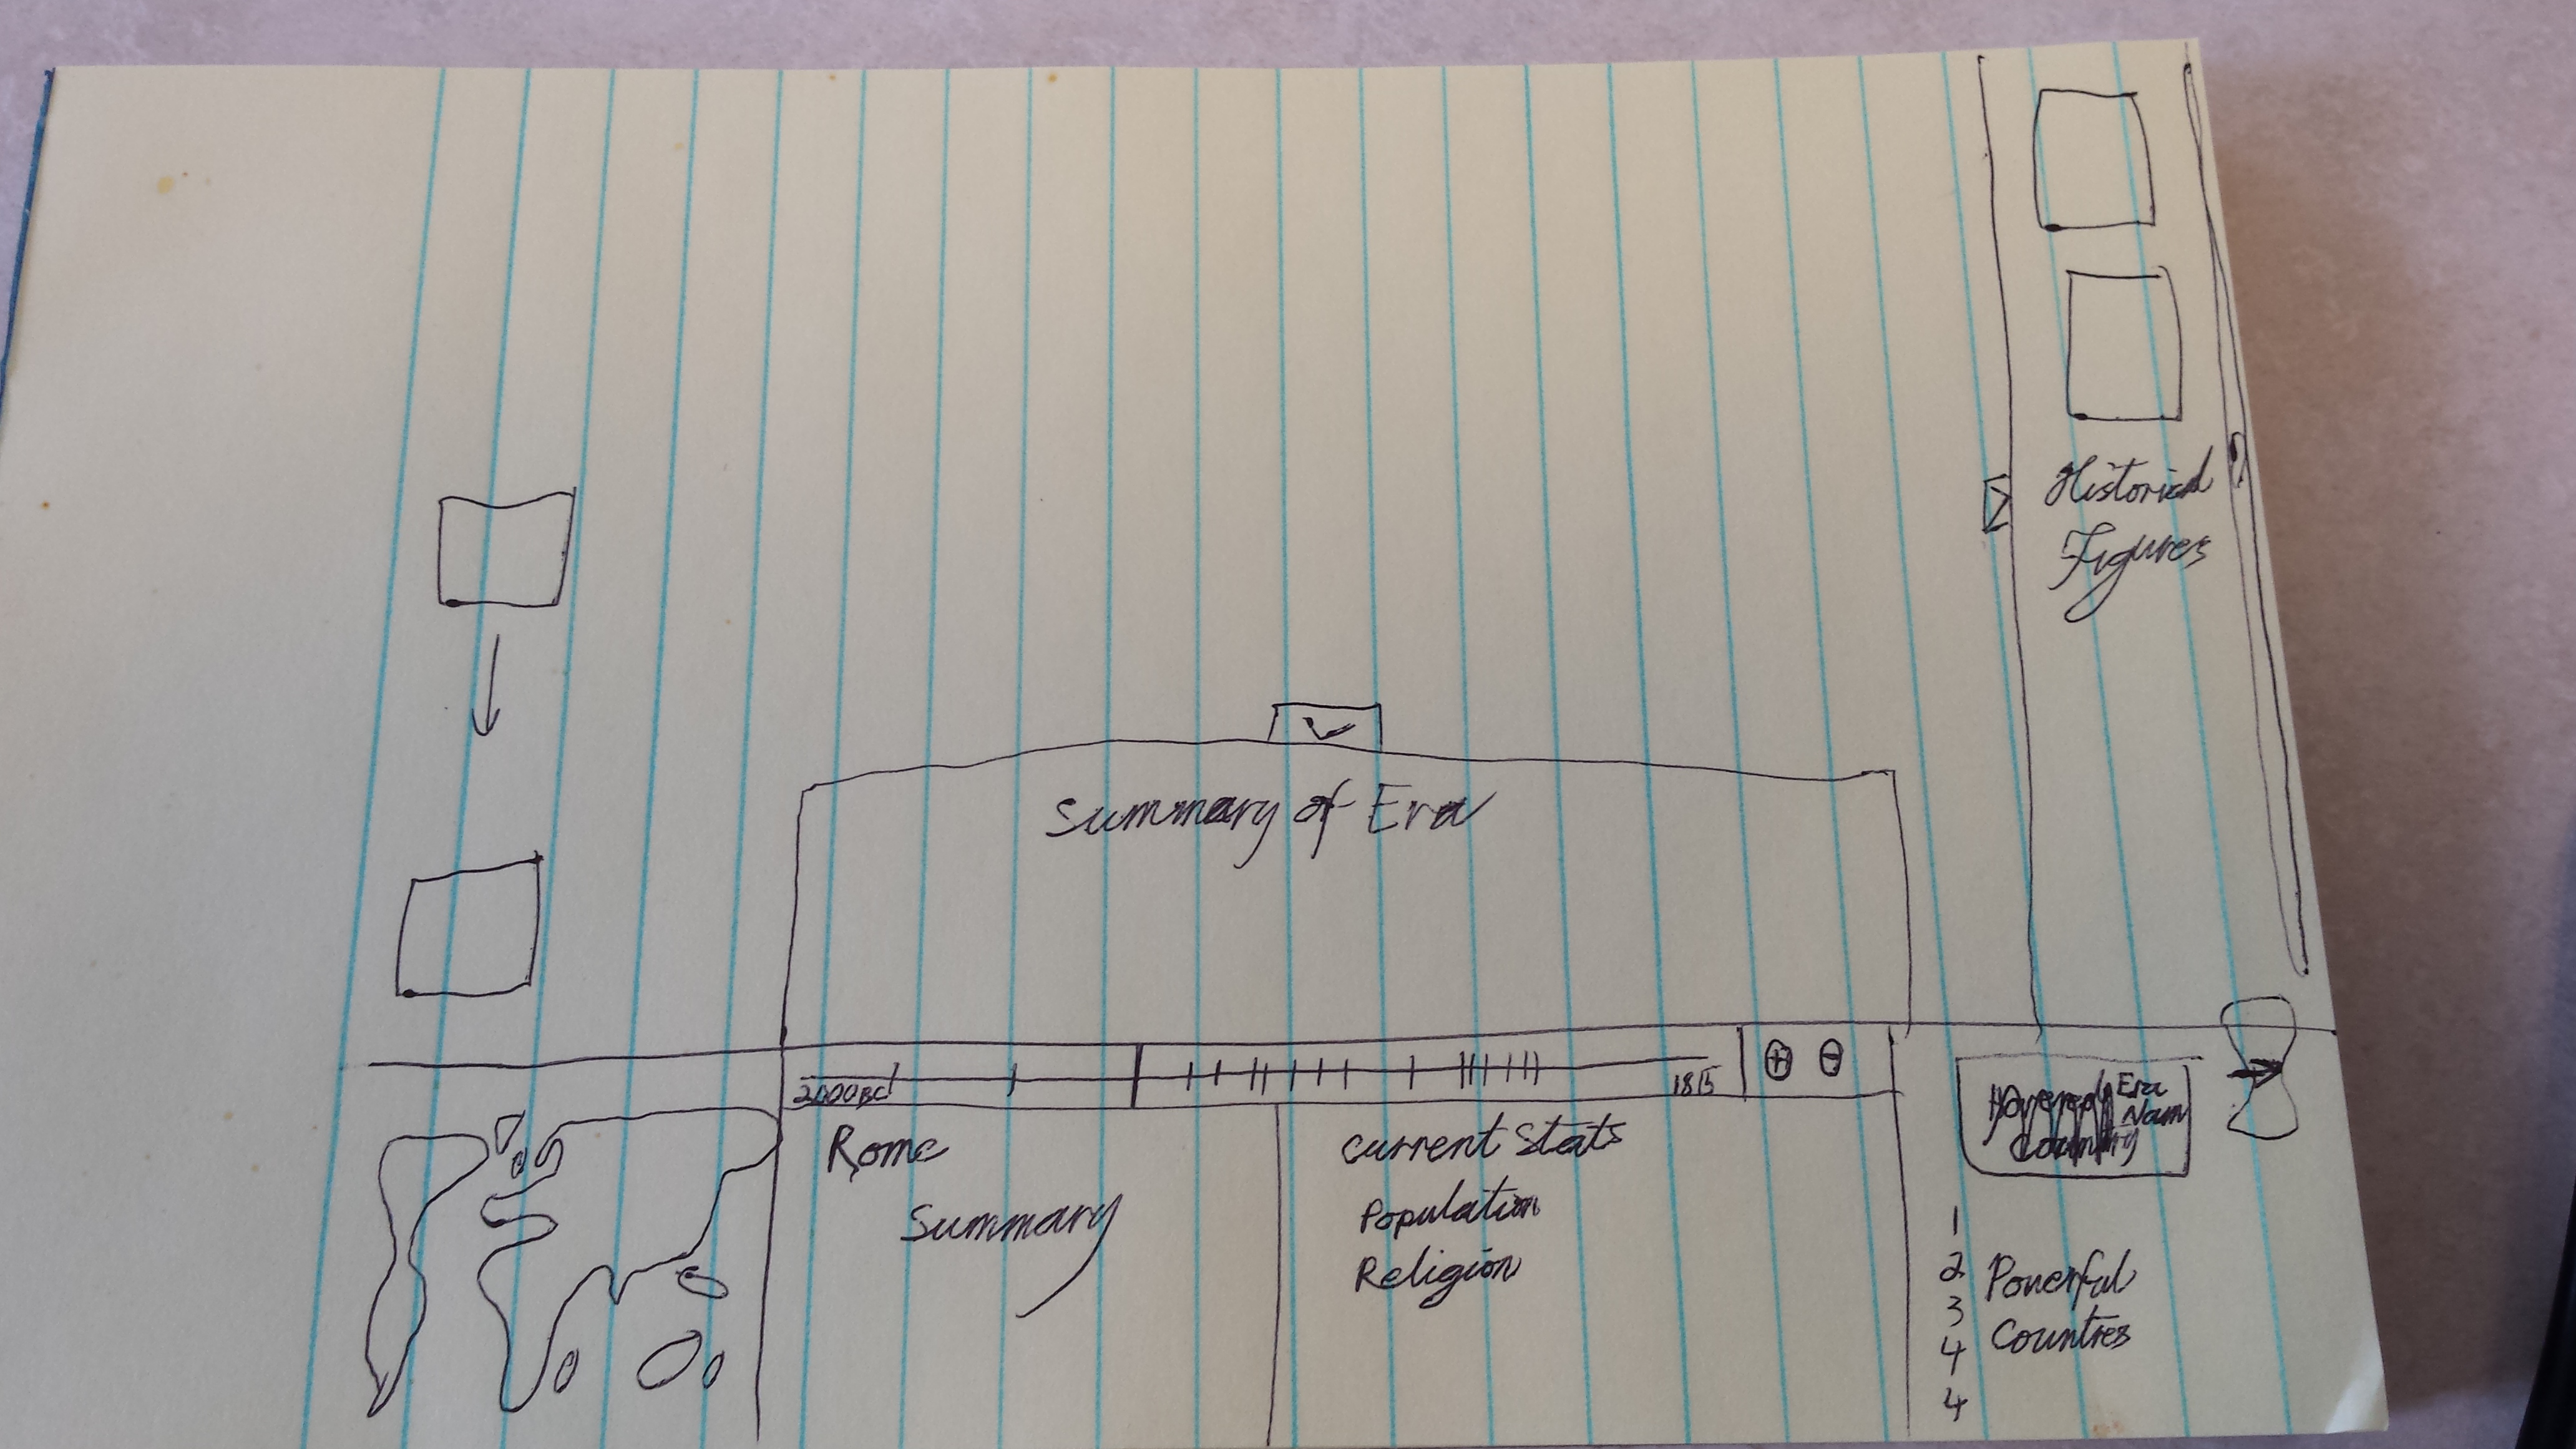
There will be a control/data box at the bottom of the screen that is split into three sections. On the left will be a mini map that consistently shows the whole world, even when the main map is zoomed in. In the primary, central box, the timeline control will reside at the top. Below will be a space for currently selected civilization data. The rightmost section will contain the name of the current era (Iron Age, Classical Age, etc.), a top five list of the largest civilizations, and a "Next Turn" button. Above the control/data box will be a togglable box that display a text summary of the events of the time period.
To the left of the map, event boxes will still drop down as they occur. On hover of a box, the region of the map where the event occured will be highlighted. On click of a box, a modal window will appear with a detailed description of the event.
To the right of the map, will be a togglable box that displays historical figures as they are alive. The images will have a border the same color as their culture group. On click, a modal window with text information about the figure will appear.
On the map itself, the current year will display on the top left of the screen. All political regions will be clickable to update the data in the data box below. Icons representing famous sites/cities will appear on the map as long as they are in existence. I would like, at some point, to encode population information on the map, perhaps through color density.
June 26th
Finalized the color/culture encodings by taking into account similar cultures as well as where each culture would be on the map throughout history to ensure that there would be no significant visual issues requiring a further splitting of culture groups. Settled on 16 culture categories, and one miscellaneous category.
Began mentally brainstorming layout concepts. (No physical mockups at this point) Decided to roughly model the layout/feel on the map interface of Sega's Total War franchise Significant historical events will fall down as boxes on the left side of the screen: when clicked this boxes will open a modal window with a description of the event. A togglable box on the right side will display significant historical figures as they are alive. The bottom of the screen would contain a text summary of the current time in history.
Completed people card with the exceptions of verifying Evon's GitHub account name, and fixing the bug that occurs when the user moves the mouse out of the image before the animation chain is complete. The card can be accessed here.
Updated journal page; still need to format it.
June 25th
Began deciding on color encoding for the different nations in my project. Compared nations from ancient times to the 1800's to see what consistencies could be leveraged. Determined that six of the major language family groupings used in McEvedy's Ancient World altas would suffice for European and near European history. However, due to the prevalance of the Indo-European familily, it will need to be split into 5-7 additional groups. Includinging five additional major language families would sufficiently encompase the rest of the world. Major language families with minimal historical significance will be universally as grey. This creates a total of 15-17 necessary colors.
Constructed a modified 4-bit color scheme to get 16 visually distinct colors for use in the map. Began making some arbitrary color/culture matches, but I will need to improve these pairings. Similar colors should be assigned to similar cultures to avoid confusions. My synesthetic preferences won't work here.
June 23rd
Received Evon's picture.
June 22nd
Began coding Evon's people card. Gathered and Photoshopped necessary images. Completed basic movements. Waiting on receiving Evon's picture to fine tune and complete the animation sequence.
Created basic framework for journal page
Linked local copy of files to GitHub
June 21st
Brainstormed ideas for Evon's people card. Developed the following ideas:
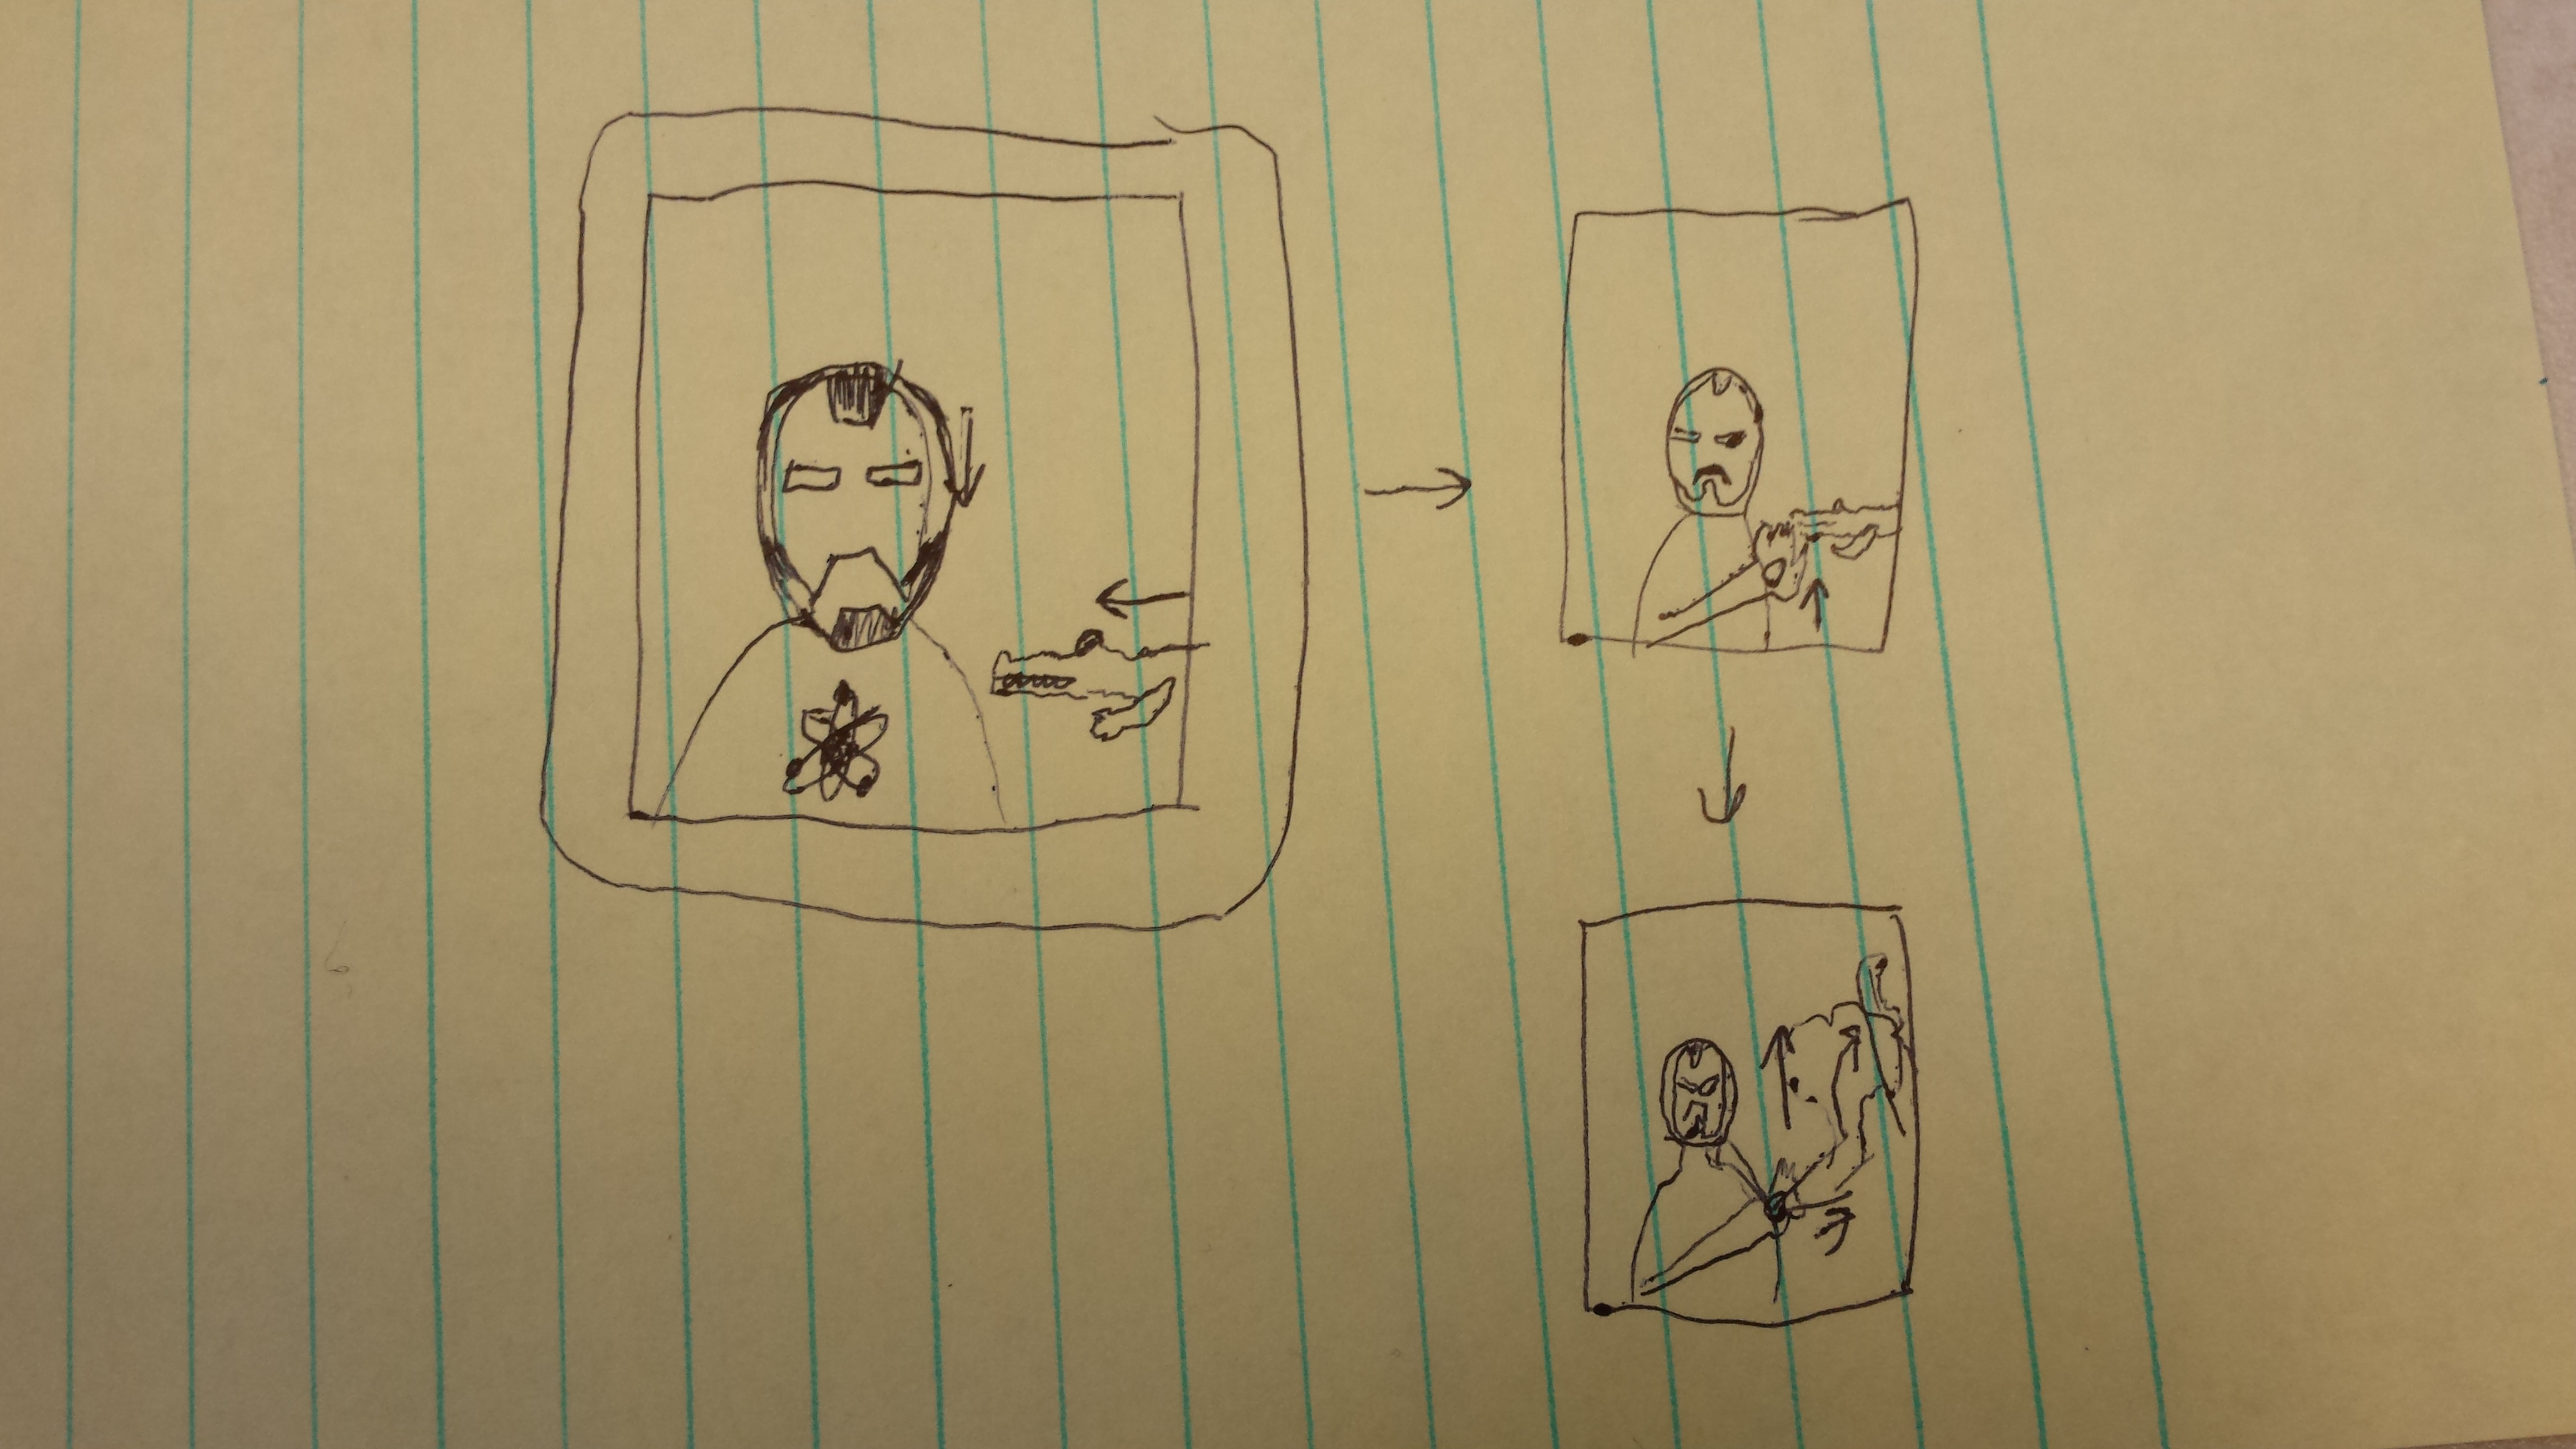
June 20th
Met with Evon Perez, for whom I will be making a people card. After aimlessly searching for a Dunkin Doughnuts so that he could get coffee, we talked at the Clover Cafe. I learned the following about Evon:
- Evon likes Star Wars; he even likes episode VII.
- He also a fan of the Avengers franchise, and the Marvel universe as a whole
- His career goal is to go into quantum computing research, where he would eventually like to be an engineer
- Evon used to live in Florida near a small pond where authorities would periodically have to remove alligators
- He strongly prefers Dunkin Doughnuts coffee over Starbucks coffee